I have panel data with 30 countries over 16 years.
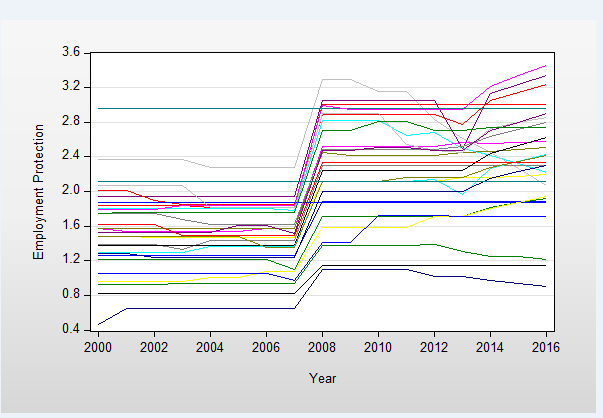
I managed to get all the countries on one XY scatter graph
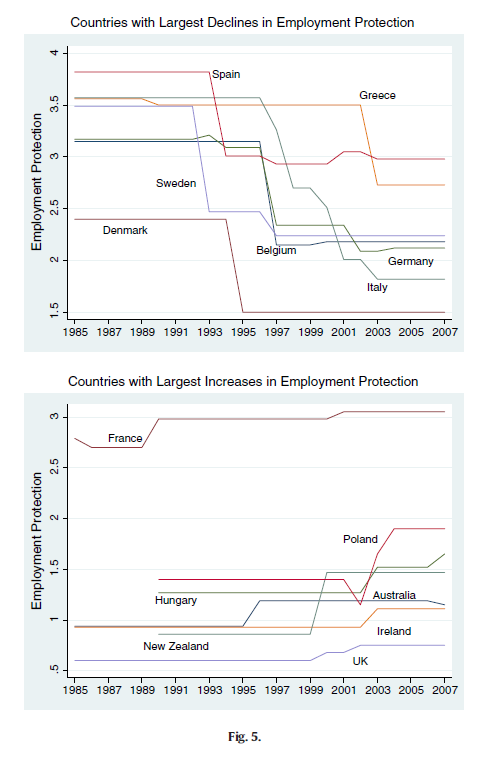
but how would I specifically pick the ones (5 countries for example) which have the largest increase and place that on one single graph and vice versa for largest decrease