Page 1 of 1
Forecasting = Click on "Forecast" in Equation?
Posted: Wed Aug 08, 2012 3:08 pm
by VictorX
Hi all,
Is forecasting in EViews done via clicking "Forecast" in Equation?
I have a workfile with the following dependent and independent variables, with sample date 2000m1 to 2012m07
"Actual" - this is the dependent variable
"W" - this is one of the independent variable
"X" - this is one of the independent variable
"Y" - this is one of the independent variable
"Z" - this is one of the independent variable
What I want to do is to estimate "Actual" 3 data points past the workfile sample date range.
Do I do this:
Import all data > select all data except the dates and open as an equation:
actual w x y z c
Method: LS, Sample: 2000m01 2012m07
Once the equation is created, I clicked on "Forecast", which pops open a window. Now, what do I do? Since my workfile's date range stops at 2012m07, do I need to create my own projected independent variables (w, x, y, z, c) and future observation dates in order for this to work?
Right now the forecast just forecasts over existing observation dates.
Thanks!
Victor
Re: Forecasting = Click on "Forecast" in Equation?
Posted: Wed Aug 08, 2012 3:13 pm
by EViews Gareth
Yes, forecasting is done via clicking on the "Forecast" button.
Yes, you can only forecast for dates/observations that are currently in your workfile. Thus you'll need to add extra dates to your workfile if you want to forecast outside of the current workfile range. You can add dates by clicking on Proc->Structure/Resize current page, and then changing the end date / number of observations.
Yes, you can only forecast for a dependent variable if data for the independent variables exists. Thus you will need to provide data for your independent variables. Note you do not need to provide data for "C"

Re: Forecasting = Click on "Forecast" in Equation?
Posted: Wed Aug 08, 2012 4:26 pm
by VictorX
Thanks! Got it to work.
I just noticed that the forecast is based on the fitted (green) line instead of the actual line. Is there a way to forecast projections off the actual dependent variable observations? It makes sense to forecast a projection off the current data, since the data is accepted as "correct".
Fitted vs Actual:
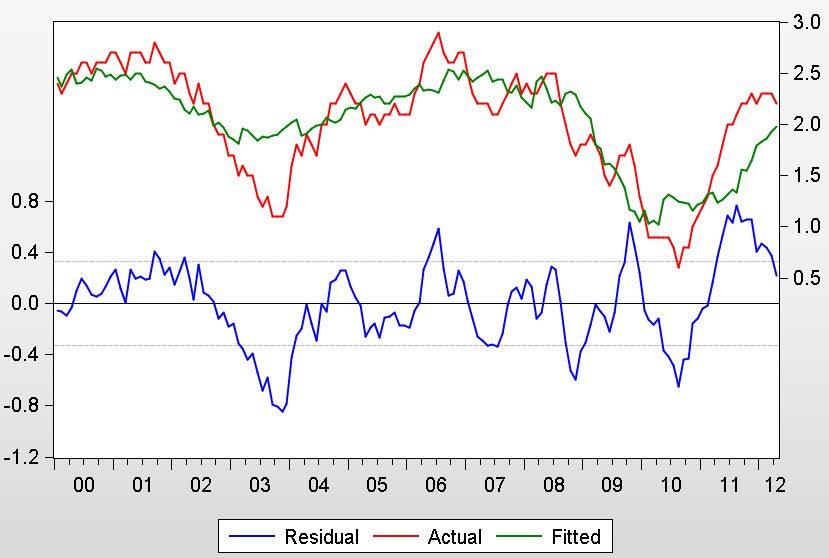
- Resids.jpg (92.4 KiB) Viewed 9128 times
Forecast extends off the Fitted line instead of the actual line
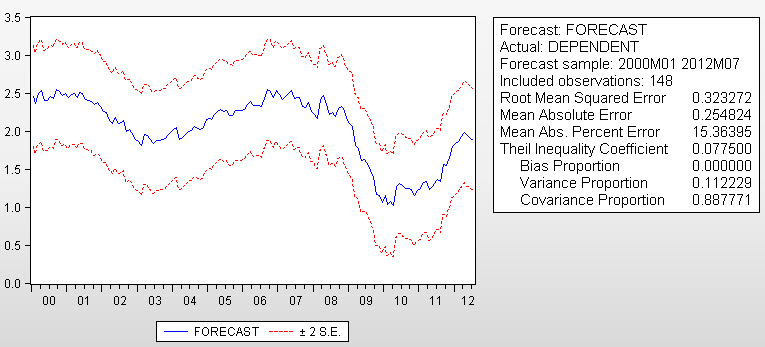
- Forecast.jpg (76 KiB) Viewed 9128 times
Re: Forecasting = Click on "Forecast" in Equation?
Posted: Wed Aug 08, 2012 4:32 pm
by startz
Well if you know the value of the variable you're trying to forecast, why not just use that value as the forecast?
Re: Forecasting = Click on "Forecast" in Equation?
Posted: Wed Aug 08, 2012 4:37 pm
by EViews Gareth
The forecast will use actual data for all periods prior to the forecast period. Change the forecast sample to start at the end of the estimation sample, rather than at the start of the estimation sample.
Re: Forecasting = Click on "Forecast" in Equation?
Posted: Wed Aug 08, 2012 5:22 pm
by VictorX
Thanks! Changing the forecast sample to start at the end of the estimation sample worked!
I then saved the forecast and graphed it along with the dependent variable to construct the "Actual + Forecast" graph
Re: Forecasting = Click on "Forecast" in Equation?
Posted: Mon Dec 16, 2013 8:54 pm
by jasonleewkd
Hi, if I may follow on the question from the OP.
I changed the forecast sample period to start from the end of the estimation sample, and end at a desired point but the graph does not show the historical (actual) values up to the end of the estimation sample, followed by the forecast values.
Am I missing something? :?
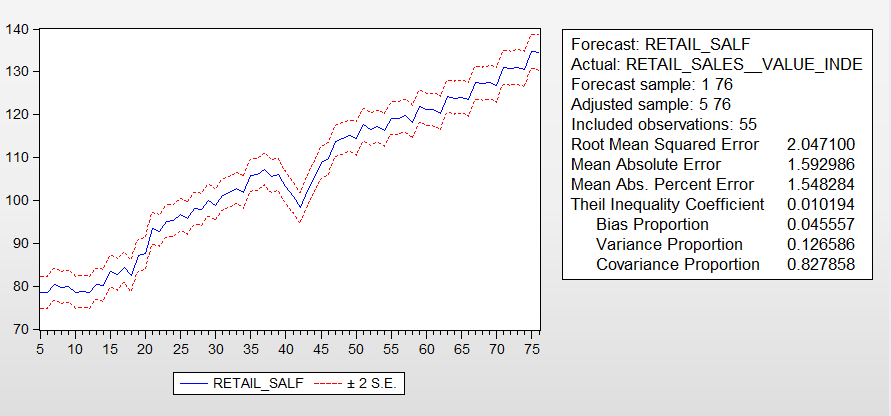
- Forecast.PNG (25.37 KiB) Viewed 8730 times
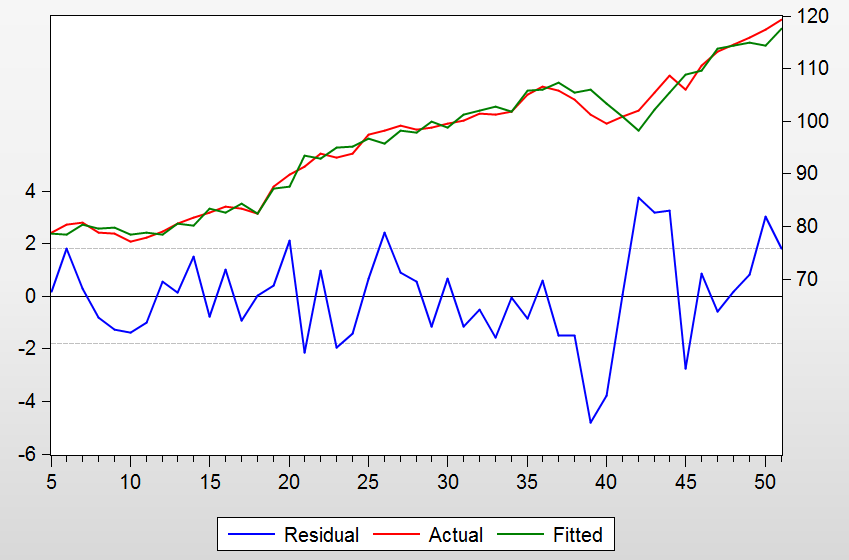
- Resid.PNG (33.26 KiB) Viewed 8730 times
Some stats for info
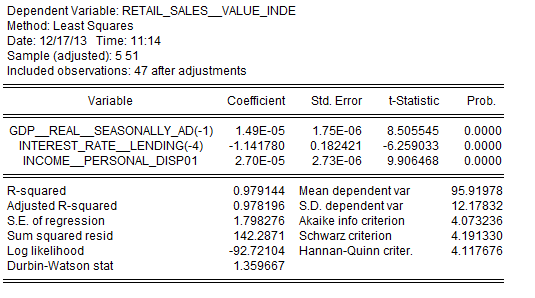
- Stats.PNG (17.73 KiB) Viewed 8730 times
Jason
Re: Forecasting = Click on "Forecast" in Equation?
Posted: Mon Dec 16, 2013 8:59 pm
by EViews Gareth
Your first picture indicates that the forecast sample was 1-76, which is, I'm guessing, the entire workfile range.
Re: Forecasting = Click on "Forecast" in Equation?
Posted: Mon Dec 16, 2013 10:54 pm
by jasonleewkd
Hi Gareth, this might be what I'm trying to achieve. The red line is the actual historical data and the blue line is the forecasted. Is it possible, and if so, how?
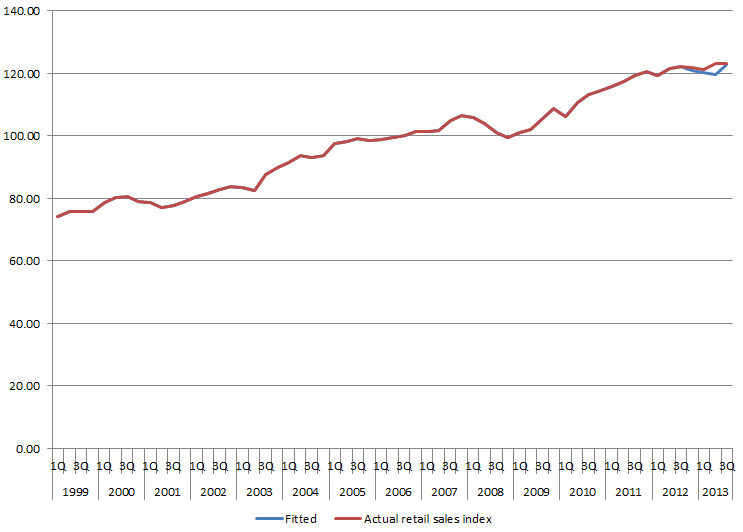
- Actual and fitted.PNG (12.64 KiB) Viewed 8720 times
Jason
Re: Forecasting = Click on "Forecast" in Equation?
Posted: Mon Dec 16, 2013 11:12 pm
by EViews Gareth
Set the forecast sample
