Page 1 of 1

Manipulating Objects in Charts

Posted: Mon Aug 03, 2015 5:32 am
by KUN0
I have an in Eviews 9 I am no longer able to click and drag text around the chart. Also doesn't work if I double-click my text box, and input new coordinates for my text.

Re: Manipulating Objects in Charts

Posted: Mon Aug 03, 2015 8:34 am
by EViews Gareth
What is the build date of your copy? (help about EViews )

Re: Manipulating Objects in Charts

Posted: Mon Aug 03, 2015 9:54 am
by KUN0
July 28, 2015

Re: Manipulating Objects in Charts

Posted: Mon Aug 03, 2015 9:59 am
by KUN0
See example below:

wfcreate(wf = "Test", page = "monthly") d5 1980 2020
smpl @all

series x=1

graph cht1.line x
cht1.addtext(0.20,-0.20) "YOU SHALL NOT MOVE!!!"
cht1.addtext(t) ""

Re: Manipulating Objects in Charts

Posted: Mon Aug 03, 2015 12:38 pm
by EViews Gareth
Got it. This will take a little while.

Re: Manipulating Objects in Charts

Posted: Tue Aug 11, 2015 2:18 pm
by EViews Jason
It will be fixed in the next patch

Re: Manipulating Objects in Charts

Posted: Tue Sep 01, 2015 11:18 am
by KUN0
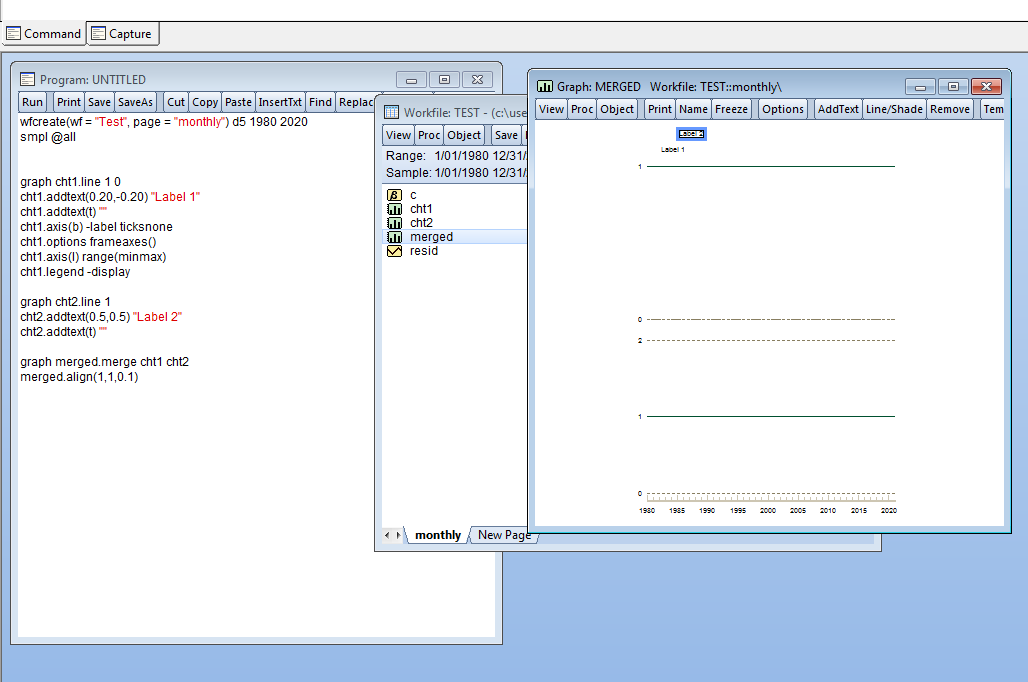
Hi. This problem was fixed but there is a followup bug. In the following program, if I look at the merged chart "merged", and click and drag "label 2" above the zero line in the top panel, it gets teleported to the top of the chart.

wfcreate(wf = "Test", page = "monthly") d5 1980 2020
smpl @all


graph cht1.line 1 0
cht1.addtext(0.20,-0.20) "Label 1"
cht1.addtext(t) ""
cht1.axis(b) -label ticksnone
cht1.options frameaxes()
cht1.axis(l) range(minmax)
cht1.legend -display

graph cht2.line 1
cht2.addtext(0.5,0.5) "Label 2"
cht2.addtext(t) ""

graph merged.merge cht1 cht2
merged.align(1,1,0.1)

Capture2.PNG
Capture2.PNG (39.93 KiB) Viewed 6345 times

Re: Manipulating Objects in Charts

Posted: Wed Sep 09, 2015 9:26 am
by EViews Jason
Also fixed in the next patch