Re: Fama-MacBeth regression
Posted: Tue Oct 21, 2014 10:40 am
Can you post the workfile you used?
Thanks for the reply. This is my workfile. I am looking forward to hearing from you.Can you post the workfile you used?
thanks for the reply.Are you using "r*" to enter your portfolio returns in the add-in? In that case you will include the "resid" series, which you probably don't want to do. One solution is to rename the returns series to something that won't overlap with other series in your workfile.
1 point that i could not understand in file "fm_example". For specific rmkt is a factor, it had value during the period, so these values corresponded with pr11 or pr12 ,..? What about for each portofilios/asset return. X is a factor, in general, X has panel data (for example 25 porfolios, 588 observations), how can it be showed in a sheet? . Could anyone help me how to present a factor in a workfile? Could you please tell me soon?First of all, make sure that you have EViews version 7.x or higher. Then, download the add-in and run the installation program (or simply unzip it). It will upload a documentation file into the related folder (C:\Users\...\Documents\EViews Addins\...), where you can find your answers.
To answer your first question, look at equations 1 and 2 in the documentation. Your other questions are not covered by the add-in and you will need to do them yourself.I am looking for help to implement following tests in the Fama-MacBeth regression. First, how can I include constant as a factor in the regression as many people do in their studies; second, how can I have the newey-west estimators from the time-series regressions and how can I test the joint significance of the loadings via SUR system; third, how can I have the t-statistics which are adjusted for errors-in-variables following Shanken (1992) and how can I have the adjusted R2 follows Jagannathan and Wang (1996) in the cross-sectional regressions. Thank you for your help
I don't understand what you're asking.1 point that i could not understand in file "fm_example". For specific rmkt is a factor, it had value during the period, so these values corresponded with pr11 or pr12 ,..? What about for each portofilios/asset return. X is a factor, in general, X has panel data (for example 25 porfolios, 588 observations), how can it be showed in a sheet? . Could anyone help me how to present a factor in a workfile? Could you please tell me soon?First of all, make sure that you have EViews version 7.x or higher. Then, download the add-in and run the installation program (or simply unzip it). It will upload a documentation file into the related folder (C:\Users\...\Documents\EViews Addins\...), where you can find your answers.
Thank you so much for your help. :)
The add-in does not handle factors that consist of multiple series.I would talk my case in details. I had 100 asset returns (in 36 months), monthly returns were estimated a below picture http://i1128.photobucket.com/albums/m48 ... yissue.png
To use addin in Eviews, my workfile inclueded:
+ rm* (representative rm1, rm2,..., rm100: monthly returns of stock 1, 2, ...., 100) in 36 months
+ factors: lnBM, lnMV, E_A, E_Y, 4 variables
Hope this picture help you understand me
I am waitng for your reply
Thanks
This is my work file. I am trying estimate returns on pm1 to pm10 and pr11 to pr55. I am not sure why I am getting the error message. Thank youAgain, you need to post the workfile you're using.
Code: Select all
equation {%subbetaeq}.ls {%subrets}(!i) c {%subfacs} ar(1)Code: Select all
equation {%subcsavg}.ls avgrets c betag ar(1)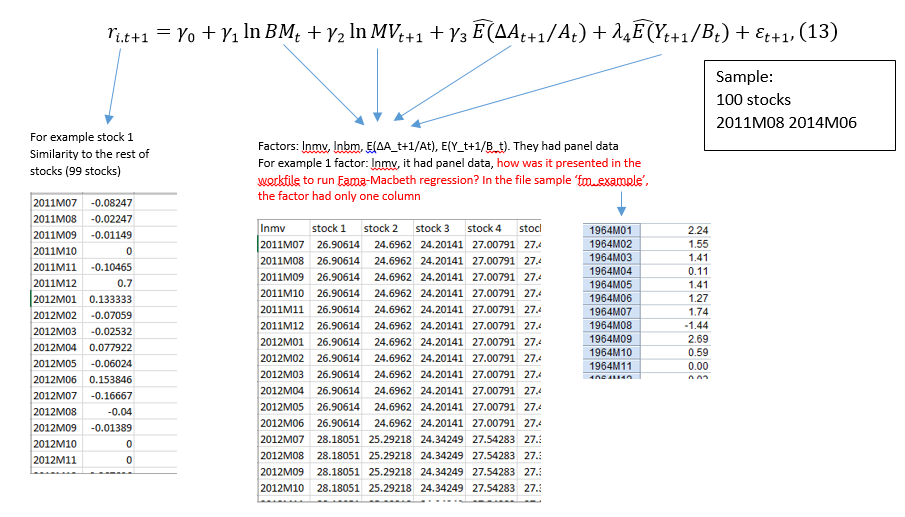