Page 2 of 2
Re: stacked bar plus line graph
Posted: Thu Aug 18, 2016 8:34 am
by osindi
sorry how do you freeze it (using code) so that it's a graph object, but still stackedbars + line?
Thanks,
Re: stacked bar plus line graph
Posted: Thu Aug 18, 2016 9:04 am
by EViews Gareth
How are you making it (via code) with the group?
Re: stacked bar plus line graph
Posted: Thu Aug 18, 2016 9:06 am
by osindi
I used the code: group1.mixed stackedbar(1,2,3,4,5,6) line(7)
Re: stacked bar plus line graph
Posted: Thu Aug 18, 2016 9:06 am
by EViews Gareth
Code: Select all
freeze(mygraph) group1.mixed stackedbar(1,2,3,4,5,6) line(7)
Re: stacked bar plus line graph
Posted: Wed Feb 23, 2022 3:34 pm
by alexanderk
Hi, this chart type does not seem to work, when I have both negative and positive contributions in the group. The positive contributions should start from the zero horizontal axis going upwards and at the same time the negative contributions should start from the zero horizontal axis, but going in the downwards direction. But this does not seem to be the case. When I have both positive and negative ones in one period, they just stack up incorrectly, not starting from zero.
Is there a solution to this?
Many thanks.
Alexander
Re: stacked bar plus line graph
Posted: Wed Feb 23, 2022 5:29 pm
by EViews Gareth
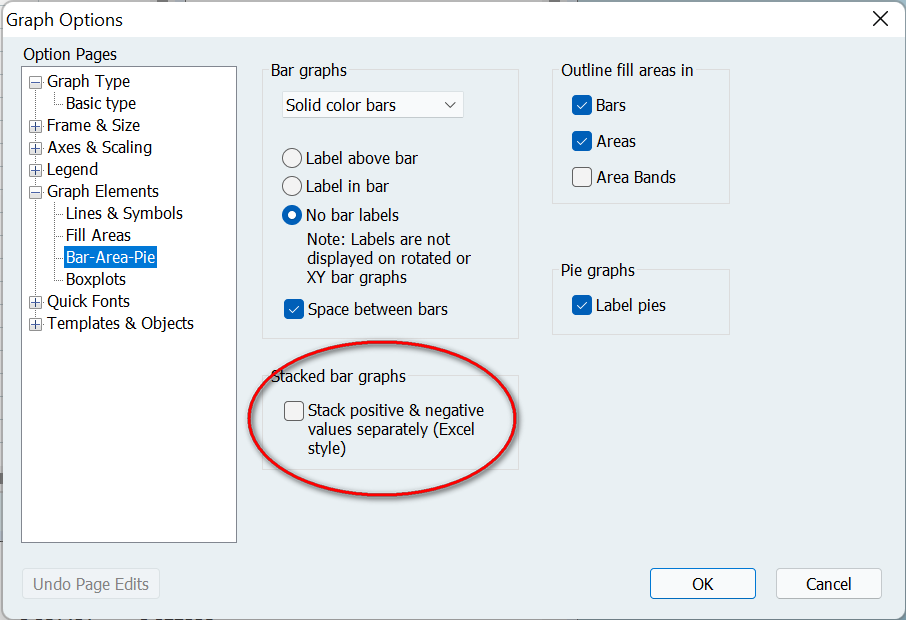
- 2022-02-23_162910.png (43.69 KiB) Viewed 56074 times
Re: stacked bar plus line graph
Posted: Thu Feb 24, 2022 2:58 am
by alexanderk
Thank you, this is very useful.
Re: stacked bar plus line graph
Posted: Wed May 28, 2025 10:32 am
by CecileBF
and how do you code symbol (FILLEDCIRCLE) instead of a line?
Re: stacked bar plus line graph
Posted: Wed May 28, 2025 5:35 pm
by EViews Gareth
In what sort of graph?
Re: stacked bar plus line graph
Posted: Fri May 30, 2025 2:31 am
by CecileBF
exactly these types of graphs: stackedbars (representing the contibutions) + symbol "circle" instead of a line (for the total).
Re: stacked bar plus line graph
Posted: Fri May 30, 2025 7:45 am
by EViews Gareth
Code: Select all
wfcreate u 20
series x=@rnd
series y=@rnd
series z=@rnd
group g x y z
freeze(gr) g.mixed stackedbar(1,2) line(3)
gr.setelem(1) symbol(filledcircle) linepattern(none)
show gr
Re: stacked bar plus line graph
Posted: Mon Jun 16, 2025 2:27 am
by CecileBF
This works well, thank you!