
Search found 2 matches
- Tue Jul 30, 2019 12:12 pm
- Forum: Data Manipulation
- Topic: Showing trends via graphs
- Replies: 3
- Views: 6081
Re: Showing trends via graphs
I have panel data with 30 countries over 16 years. I managed to get all the countries on one XY scatter graph https://i.gyazo.com/98aa28be93981fc9c977458c3a3d329d.png but how would I specifically pick the ones (5 countries for example) which have the largest increase and place that on one single gra...
- Tue Jul 30, 2019 11:50 am
- Forum: Data Manipulation
- Topic: Showing trends via graphs
- Replies: 3
- Views: 6081
Showing trends via graphs
Hello,
Is it possible to show trends such as in the image blow via the graphing function?
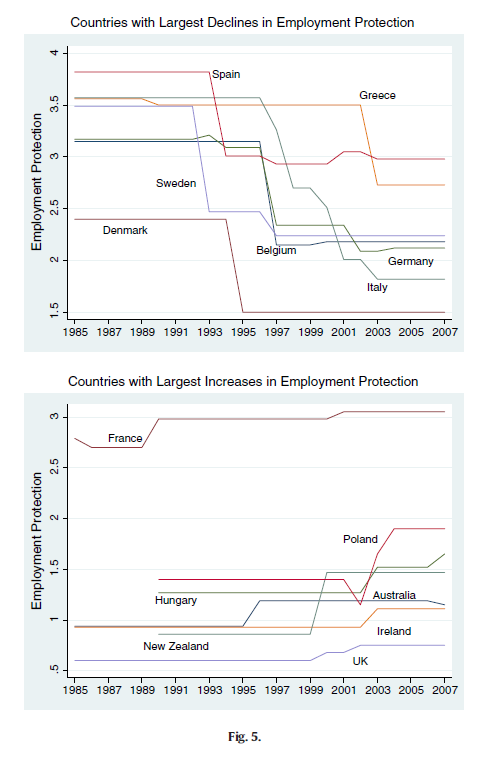
Is it possible to show trends such as in the image blow via the graphing function?